Stablecoins Are Quietly Becoming Business Infrastructure, NOWPayments Data Shows / Photo: © Chainwire.org ( 532481 )

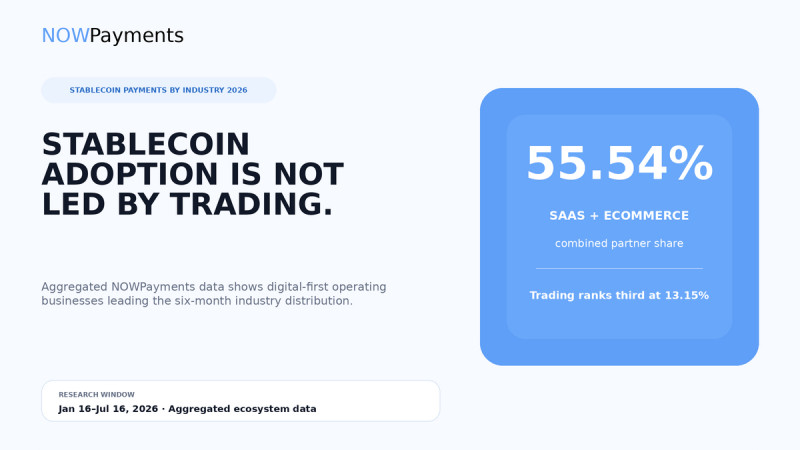
SaaS and eCommerce increased their combined share from 48.26% to 55.54%, while Trading moved from 14.07% to 13.15%.
Businesses can build stablecoin infrastructure around the wrong problem.
The mistake is treating stablecoins primarily as a coin-and-network decision. For a digital business, they may need to support a much broader set of operating workflows, including billing, checkout, settlement, payouts, and reconciliation.
Which of those workflows matters most depends on the business model.
New aggregated data from NOWPayments shows the industry mix shifting toward businesses that use payments as part of their day-to-day operations. Between January 16 and July 16, 2026, SaaS and web services accounted for 27.78% of classified partners. eCommerce Marketplaces followed at 27.76%. Together, the two sectors represented 55.54% of the sample. During the same period in 2025, their combined share was 48.26%. The increase of 7.28 percentage points represents a 15.08% year-over-year rise in their combined share.
Trading remained an important part of the sample, but its share moved in the opposite direction. It declined from 14.07% in 2025 to 13.15% in 2026, leaving trading in third place behind SaaS and eCommerce.
The clearest upward shift came from SaaS. Its share increased from 15.58% to 27.78% in one year, closing a gap of 17.10 percentage points with eCommerce. The emerging picture is not stablecoins replacing trading. It is stablecoin adoption expanding into the operating infrastructure of digital businesses.
Unless otherwise stated, industry-distribution figures compare January 16 to July 16, 2025, with January 16 to July 16, 2026.
The Partner Mix Is Shifting Toward Operational Use Cases
In 2025, eCommerce marketplaces led the dataset at 32.68%. SaaS and Web Services followed at 15.58%, with Trading close behind at 14.07%.
One year later, SaaS had increased its share by 12.20 percentage points to 27.78%. eCommerce stood at 27.76%, leaving only 0.02 percentage points between the two sectors. Their combined share rose from 48.26% to 55.54%. More than half of the classified partners in the 2026 sample therefore came from two sectors built around digital transactions, recurring services, and online customer relationships.
The rest of the partner mix changed more gradually.
Financial Services moved from 9.00% to 6.35%. Gambling and iGaming increased from 6.20% to 6.87%, and adult platforms rose from 4.99% to 5.89%. Charity declined from 2.27% to 1.40%, while TGE/Presale moved from 2.12% to 1.35%.
These figures measure changes in each industry’s share of the sample. They do not measure absolute partner growth. A category may lose share because another category expanded faster.
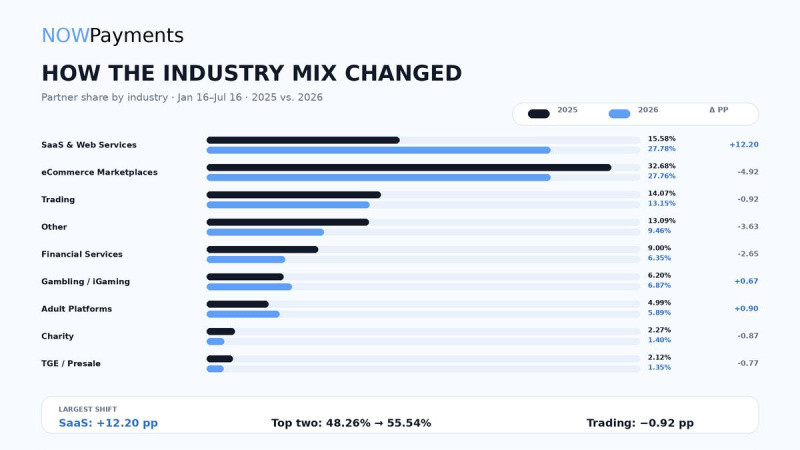 Methodology: Each percentage represents an industry’s share of the full aggregated partner sample classified across the same nine categories. The comparison covers January 16 to July 16 in both 2025 and 2026. Each period was normalized independently. Absolute partner counts are not disclosed, and percentages are rounded to two decimal places. The findings describe partner distribution within the NOWPayments dataset, not payment volume, transaction value, or market-wide industry share.
Different Business Models Need Different Stablecoin Workflows
The industry data becomes useful when it is translated into the operating questions each business model may need to solve.
For a SaaS company, stablecoin payments may need to connect with recurring billing, invoice matching, account activation, renewals, settlement, and financial reconciliation.
A marketplace may need stablecoins to work across a longer flow. The payment can begin at checkout and continue through refunds, seller settlement, affiliate commissions, and other payouts.
Trading platforms face a different set of requirements. Their priorities may include asset and network coverage, confirmation policies, liquidity, and treasury controls.
These are potential workflow drivers, not a universal description of every company in each category. The point is that the same stablecoin can serve all three sectors while performing a different operational job in each one.
This is why a business should define the workflow before choosing the asset and network.
The Network Mix Also Changes by Industry
The successful-payment data shows that industry differences extend to network usage.
USDT on TRON accounted for 54.58% of the measured successful-payment sample within eCommerce marketplaces. Its share was 12.04% in trading and 9.60% in SaaS and web services.
Within this dataset, USDT TRC20 was about 4.5 times as prominent in eCommerce as in Trading and 5.7 times as prominent as in SaaS.
The corresponding shares were 4.76% in Gambling and iGaming, 1.85% in Financial Services, 1.49% in Other, and 0.60% in Charity. Adult Platforms and TGE/Presale each recorded a 0% share in the analyzed sample.
The difference supports the same conclusion as the industry data. A stablecoin setup that fits one business model may not fit another.
For an eCommerce business, USDT on TRON may play a visible role in checkout activity. A SaaS company may see a different asset and network mix. Trading platforms may need broader coverage across both.
Businesses should validate these decisions against their own successful-payment data instead of importing the preferences of another industry.
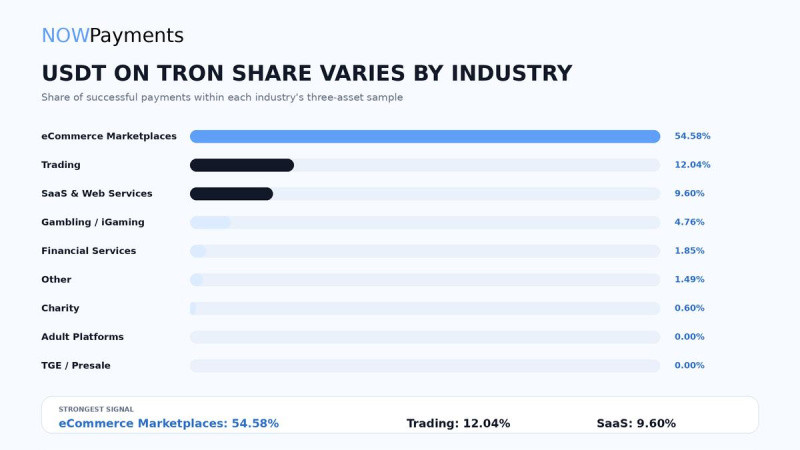
Methodology: Each percentage represents USDT TRC20’s share of the aggregated successful-payment sample within the corresponding industry. Absolute transaction counts are not disclosed. Failed, expired, refunded, and test transactions are excluded. The figures describe activity within the NOWPayments ecosystem and should not be interpreted as market-wide currency shares. A 0% result means that no successful USDT TRC20 payments were recorded in the analyzed sample for that category.
Build the Workflow Before Choosing the Rails
The five operating areas introduced at the beginning provide a practical framework for evaluating stablecoin infrastructure.
Not every business needs all five. A SaaS platform may focus on billing and reconciliation. A marketplace may need checkout, settlement, and payouts. A trading platform may prioritize network coverage, liquidity, and treasury controls.
The company should first identify which workflows apply. Asset and network selection comes after that.
“The mistake is asking which stablecoin is best. The better question is: best for what?” said Kate Lifshits, Commercial Director at NOWPayments. “Businesses should define the billing, checkout, settlement, payout, and reconciliation flow first. The coin and network should serve that workflow – not the other way around.”
Lifshits explores the commercial side of crypto payments in her Cryptopolitan series, Crypto That Works for Business. The first column, The 22% Sales Boost Hiding in Your Crypto Checkout, examined how payment infrastructure can affect checkout performance. Future installments will continue looking at where crypto payments can increase revenue, lower costs, and remove operational friction.
Stablecoin strategy starts with the job the money needs to do. The coin and network come next.
About NOWPayments
NOWPayments is a crypto business ecosystem designed to help companies accept payments, automate mass payouts, manage stablecoin treasury, and scale global digital asset operations through a single infrastructure. The platform supports more than 350 cryptocurrencies, over 30 stablecoins, flexible settlement options, and enterprise-grade APIs.
Source article: https://chainwire.org/2026/10/08/stablecoins-are-quietly-becoming-business-infrastructure-nowpayments-data-shows/
T.Kobayashi--JT